Weibull Analysis

From raw failure data to optimized PM schedule. One click.

Upload your failure data. Get Weibull distributions, β/η parameters, PF curves, and actionable PM recommendations.

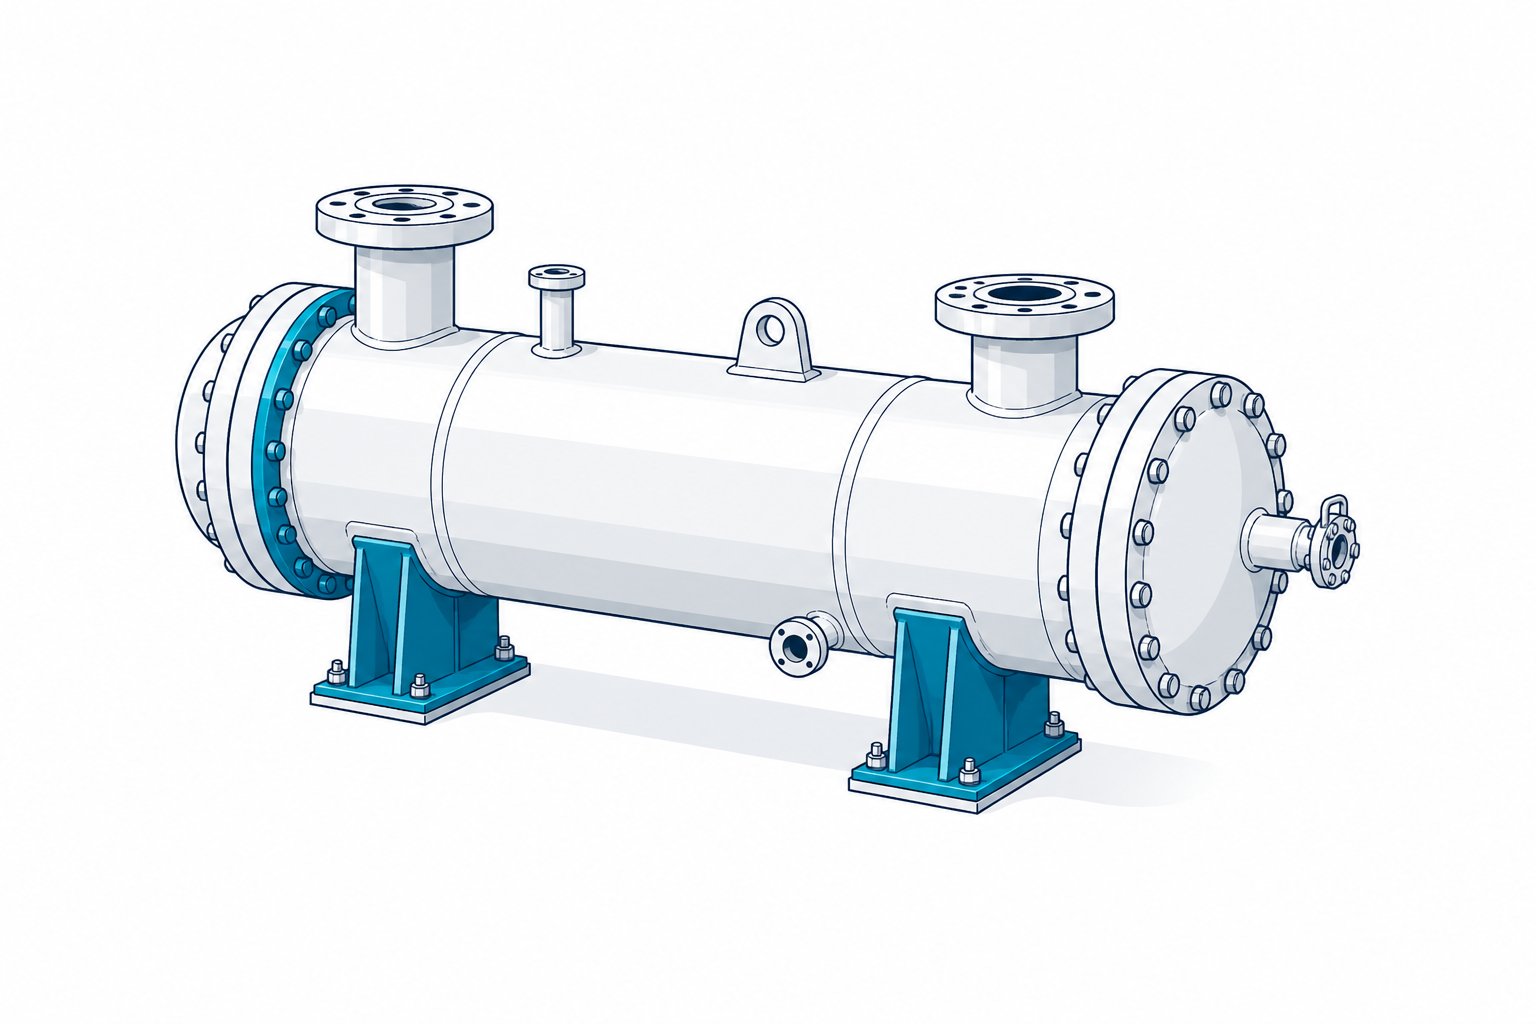
Pressure vessel V-301 — relief valve actuation Weibull analysis
Asset under analysis
Weibull 2P · β = 1.84 · η = 3,840 cycles
V-301 · Pressure vessel · relief valve fleet
−38% PM
The Pain Today

What the manual workflow actually costs you.

01

Needs specialized skills.

Most maintenance teams don't have a reliability engineer who can run Weibull analyses on the fly. So they don't.

02

Calendar-based PMs by default.

Assets get PMs every 6 months because that's what the template says — not because that's when they actually fail.

03

Failure data sits in CSV graveyards.

CMMS exports nobody opens. Decisions made on gut feel. Overmaintenance on half the fleet, undermaintenance on the other half.

How our AI agent handles it

Input → process → output.

STEP 01

Upload failure data

CSV, CMMS export, Excel — we handle the messy formats.

STEP 02

Fit distribution

MLE / rank regression. 2P and 3P Weibull tested.

STEP 03

Extract β / η

Shape + scale parameters with confidence intervals.

STEP 04

Generate PF curve

Potential-to-functional failure window visualized.

STEP 05

Recommend PM interval

Optimal interval minimizing lifecycle cost.

What You Get

Concrete deliverables. Ready to ship.

  • Weibull report (PDF)

    Distribution, β/η, CI, goodness-of-fit.

  • Failure distribution plot

    Visual you can put in a board deck.

  • PF curve

    For condition-based decisions.

  • PM interval recommendation

    Optimal interval + cost trade-off chart.

  • Comparison to current PM

    Overmaintenance / undermaintenance flag.

  • CMMS-ready output

    New interval ready to push to SAP PM / Maximo.

Weibull-V301-relief-valves.pdf
Pressure vessel V-301 — relief valve actuation Weibull analysis
Asset under analysis
V-301 · Pressure vessel · relief valve cycles
Weibull 2P · MLE fit

V-301 relief-valve fleet · β = 1.84 · η = 3,840 cycles

Optimal PM → 3,400 h 0h 3,000h 6,000h
Shape β
2.14
Scale η
4,230 h
Savings
−38% PM
Side by side

Manual way vs. Rob Reliability AI.

Manual way

  • Skills neededSpecialized reliability engineer
  • Time per assetDays, if ever done
  • CoverageTop 10% of assets, maybe
  • PM basisCalendar / gut feel
  • RefreshRarely re-run

With Rob Reliability

  • Skills neededAny reliability engineer
  • Time per assetMinutes
  • CoverageFull fleet
  • PM basisData-driven, condition-aware
  • RefreshRun on every new data cycle
Rob — Founder, Senior Reliability Engineer
Built by a 20+ year reliability expert

Not theory. Practice.

Rob has run Weibull, RAM and LCC studies on rotating and static equipment — pumps, compressors, heat exchangers, HVs. The agent gives any reliability engineer access to the same toolkit.

Ready to try Weibull Analysis
on one of your assets?

30-minute discovery call. We pick one asset, show you the output on your data, and size the deployment. No pitch. No obligation.

Book your call
Other use cases

← All use cases
Unlock 300+ hours. Book a 30-min call.
Book

Accent

Hero

Font